Purpose
- Colorimetric technique to measure and quantify protein concentration in biological samples.1
History
- Developed in 1976 by Bradford and modified from Bollag and Edelstein in 1991 for the 10-mL test tube format.2
Mechanism of Action
- Coomassie brilliant blue G-250 (CBBG) dye binds to proteins through ionic and hydrophobic interactions, mostly at the proteins' basic amino acid residues e.g. arginine and lysine.
Materials and Reagents for Bradford Assay
- Requirements: Known bovine serum albumin (BSA) or Immunoglobulin G (IgG), Coomassie dye reagent, Tris-HCl or phosphate-buffered saline (PBS) buffers for diluting (refer to Compatibility list below).
- Equipment: Spectrophotometer, quartz cuvettes or plate reader, well-plates and micropipettes with accompanying tips.
CBBG Working Solution
- 100 mg of CBBG, 50 mL 95% EtOH, 100 mL 85% phosphoric acid, mix then diluted up to 1 liter with distilled water to afford 120.86 mM CBBG or 0.1% w/v CBBG or 1X Bradford reagent.
- The resulting solution is stable for several months stored in the dark at room temperature and longer at 4°C.
- Proportions may be scaled up or down as desired.
- Commercial Bradford assay kits [ab102535] provide 1x pre-prepared CBBG/Bradford reagent for convenience and consistency.
Example Protocol by Cuvette Spectrophotometer
- Prepare 100 µL of 1:50 diluted protein sample in buffer solution e.g. PBS in cuvette as the sample.
- Prepare 20 µL of 1x PBS cuvette as the control.
- Serially dilute protein standards to generate a standard protein curve of known [protein] concentrations, e.g. BSA (for stability, purity, lacks enzymatic activity, produces linear response curve, availability) in range of e.g. 0.1 – 1 mg/mL.
- 20 µL of each standard followed by 1 mL of 1X Bradford reagent and mix, incubate for 5 min. Transfer to cuvette.
- Sample preparation buffers and handling recommendations:
- Centrifuge and filter samples before analysis to prevent interference.
- Blank the spectrophotometer with blank to zero absorbance or 100% Transmittance.
- Measure absorbance values to protein standards and sample at full spectrum or λmax 595 nm.
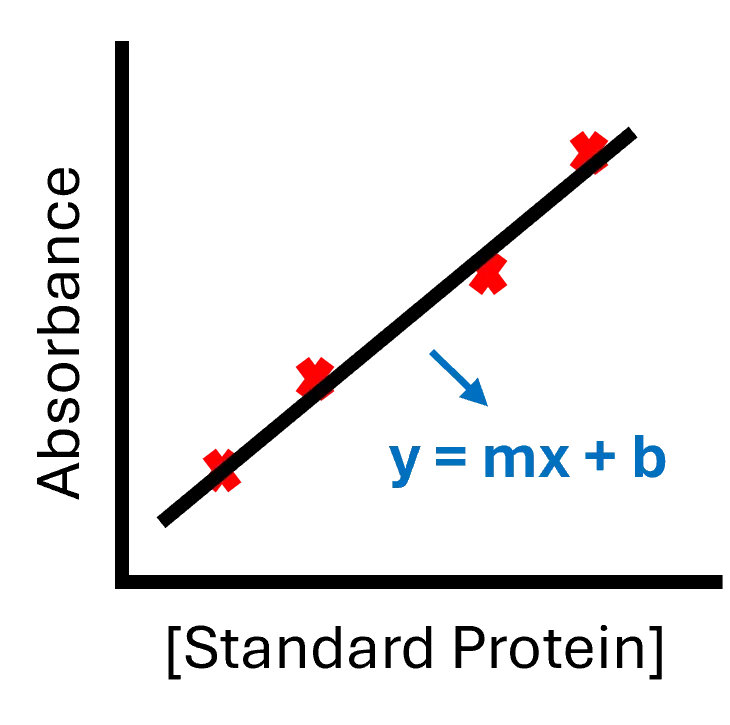
- Create standard curve by plotting λmax 595 nm (y-axis) against [standard] in µg/mL.
- Determine the equation of the curve to obtain y = mx + b form, where:
- y = absorbance
- x = protein concentration
- m = slope of the line
- b = y-intercept
- Determine the equation of the curve to obtain y = mx + b form, where:
- Calculate the sample's unknown concentration by substituting values in the linear equation and solve for x-variable.
Example Protocol by 96-Well Plate
- Adapting the procedure from Example Protocol by cuvette-spectrophotometer to a 96-well plate format. Scale down the volumes by a factor of 5. Therefore, 200 µL of 1x Bradford Working Solution with 20 µL of protein sample or 4 µL of each protein standard.
Commentary
Special Considerations
- Optimal pH: Bradford assay requires slightly acidic pH near 6.5 to 7.5 environment for optimal performance.
- Protein-dependent variations: In Bradford assay, the dye-protein interaction relies on electrostatic interactions of sulfonate groups with basic residues: arginine and lysine. Therefore, proteins predominantly hydrophobic and have high proportion of arginine and lysine residues produce higher absorbance values than other proteins. This variation can be mitigated with changing standards, e.g., changing from BSA to BGG.
- Specifications
| Criteria | Standard BSA Expected Value |
|---|---|
| Precision (calibration curve) | Variance R2 ≥ 0.98 |
| Sensitivity | N/A |
| Detection Limit (LOD) | N/A |
| Dynamic range LOQ | 1 µg/mL |
| Dynamic range ULQ | 1.5 mg/mL |
| Selectivity | N/A |
| Auxiliary Criteria | Estimated Value |
|---|---|
| Speed | Fast |
| Ease and convenience | Easy |
| Operator skill | Low |
| Cost | Low ($0.40/analysis) |
| Dynamic range ULQ | 1.5 mg/mL |
| Selectivity | N/A |
Advantages
- Speed: Completed in less than 1 hour.
- Sensitivity: Protein concentration detection from 1–1000 µg/mL.
- Compatibility with high-throughput quantification: 96-well plate format for rapid screening of many protein samples.
- Wide range of protein compatibility: Including soluble and membrane-bound proteins.
Limitations
- Interference from detergents and reducing agents that can bind to CBBG dye, altering its absorbance.
- Accuracy of the results depends on the quality of the protein standard.
Critical Steps: What to Look For, What to Expect (Visually)
- CBBG/Bradford Stock Solution appears as a brown color. The CBBG/Bradford working or diluted solution appears as a light brown color.
- CBBG by itself is brown with a maximum absorbance at 465 nm, but after binding to proteins, turns blue coloration with a maximum absorbance at 595 nm. This color shift is directly proportional to protein concentrations; i.e., as protein concentrations increase, more CBBG binding results in deeper blue color.
Applications
- Quantify protein expression from viral vectors.
- As an outcome measure when optimizing gene delivery systems.
- In cancer research, protein quantification in cancer tissue and preliminary screening of therapeutic protein levels.
- Quantify total protein before performing immunoassays.
- In infectious disease research, to measure viral protein expression in HIV and influenza studies; quantify bacterial protein production in antibiotic resistance research; develop protein-based diagnostic assays for infectious diseases.
Comparison with Other Protein Quantification Methods
An alternative to the Bradford assay is the bicinchoninic acid (BCA) assay, a copper-based method that measures protein concentrations through colorimetric reactions.
Commercial Products
Abcam: Bradford Assay Kit (ab102535)3
- Bradford assay kit.
- Contains 5X protein assay solution (20 mL) and Protein Standard I (1.5 mL).
Bio-Rad: Bradford Assay Kit (5000201)4
- Quick Start Bradford Protein Assay.
- Contains ready-to-use dye reagent at 1x concentration and two protein standards (either bovine serum albumin or bovine γ-globulin standards) at seven prediluted concentrations (0.125, 0.25, 0.5, 0.75, 1.0, 1.5, and 2.0 mg/mL).
Millipore Sigma: Bradford Reagent (B6916-500ML)5
- Bradford reagent.
- Contains 1 ready-to-use Bradford reagent for determining concentration of unknown protein sample(s) in the range of 1.0 µg/mL – 1.4 mg/mL of protein.
- Reducing sugars and reducing substances along with thiols do not interfere with this reagent.
Compatibility Table
| Substance | Compatible if concentration is below this value |
|---|---|
| Acetone | 10% |
| Acetonitrile | 10% |
| Ammonium sulfate | 1 M |
| Ampholytes pH 3-10 | 0.50% |
| ASB-14 | 0.03% |
| Ascorbic acid | 0.05 M |
| Bis-Tris, pH 6.5 | 0.2 M |
| Calcium chloride | 0.04 M |
| CHAPS | 10% |
| CHAPSO | 10% |
| Deoxycholic acid | 0.20% |
| Dithioerythritol (DTE) | 0.01 M |
| Dithiothreitol (DTT) | 0.01 M |
| DMSO | 5% |
| Eagle's MEM | no interference |
| Earle's salt solution | no interference |
| EDTA | 0.2 M |
| EGTA | 0.2 M |
| Ethanol | 10% |
| Glucose | 20% |
| Glycerol | 5% |
| Glycine | 0.1 M |
| Guanidine HCl | 2 M |
| Hank's salt solution | no interference |
| HCl | 0.1 M |
| HEPES | 0.1 M |
| Imidazole | 0.2 M |
| Magnesium chloride | 1 M |
| 2-Mercaptoethanol | 1 M |
| MES | 0.1 M |
| Methanol | 10% |
| Modified Dulbecco's PBS | no interference |
| MOPS | 0.1 M |
| NAD | 0.002 M |
| Nonidet P-40 | 0.25% |
| Buffer Additives | |
| ACES, pH 7.8 | 100 mM |
| N-Acetylglucosamine in PBS, pH 7.2 | 100 mM |
| Bicine, pH 8.4 | 100 mM |
| Bis-Tris, pH 6.5 | 100 mM |
| Calcium chloride in TBS, pH 7.2 | 10 mM |
| CelLytic BTM Reagent | Concentrated no interference |
| CHES, pH 9.0 | 100 mM |
| Cobalt chloride in TBS, pH 7.2 | 10 mM |
| EPPS, pH 8.0 | 100 mM |
| Ferric chloride in TBS, pH 7.2 | 10 mM |
| Glycine | 100 mM |
| HEPES, pH 7.5 | 100 mM |
| Imidazole, pH 7.0 | 200 mM |
| MES (0.1 M), NaCl (0.9%), pH 4.7 | undiluted |
| MES, pH 6.1 | 100 mM |
| MOPS, pH 7.2 | 100 mM |
| Nickel chloride in TBS, pH 7.2 | 10 mM |
| PBS; Phosphate (0.1 M), NaCl (0.15 M), pH 7.2 | undiluted |
| PIPES, pH 6.8 | 100 mM |
| Sodium acetate, pH 4.8 | 180 mM |
| Sodium bicarbonate | 0.1 M |
| Sodium citrate, pH 4.8 or pH 6.4 | 200 mM |
| Sodium Citrate (0.6 M), MOPS (0.1 M), pH 7.5 | undiluted |
| Sodium phosphate | 0.1 M |
| TBS; Tris (25 mM), NaCl (0.15 M), pH 7.6 | undiluted |
| Tricine, pH 8.0 | 100 mM |
| Triethanolamine, pH 7.8 | 100 mM |
| Tris | 2.0 M |
| Tris (25 mM), Glycine (192 mM), pH 8.0 | undiluted |
| Tris (25 mM), Glycine (192 mM), SDS (0.1%), pH 8.3 | 1:2 dilution |
| Zinc chloride in TBS, pH 7.2 | 10 mM |
| Detergents | |
| BRIJ®-35 | 0.13% |
| BRIJ-52 | 0.03% |
| CHAPS | 5% |
| CHAPSO | 5% |
| Deoxycholic acid | 0.05% |
| Nonidet P-40 (IGEPAL® CA-630) | 0.50% |
| SB3-14 | 0.13% |
| Octyl β-glucoside | 0.50% |
| Octyl β-thioglucopyranoside | 3% |
| SDS | 0.13% |
| SPANTM 20 | 0.50% |
| TRITON® X-100 | <0.1% |
| TRITON X-114 | 0.13% |
| TRITON X-305 | 0.50% |
| TRITON X-405 | 0.50% |
| TWEEN® 20 | 0.06% |
| TWEEN 60 | 0.10% |
| TWEEN 80 | 0.06% |
| Chelating Agents | |
| EDTA 100 mM | 100 mM |
| EGTA 2 mM | 2 mM |
| Sodium citrate, pH 4.8 or pH 6.4 | 200 mM |
| Reducing & Thiol Containing Agents | |
| 2-Mercaptoethanol | 1.0 M |
| Ascorbic acid | 50 mM |
| Cysteine | 10 mM |
| Dithioerythritol (DTE) | 1 mM |
| Dithiothreitol (DTT) | 5 mM |
| Potassium thiocyanate | 3.0 M |
References
- Bradford assay. Abcam, https://www.abcam.com/en-us/knowledge-center/western-blot/bradford-assay (accessed 13-May-2026).
- Kielkopf, C. L.; Bauer, W.; Urbatsch, I. L. Bradford Assay for Determining Protein Concentration. Cold Spring Harb Protoc 2020, 2020 (4), 102269.
- Bradford Assay Kit Abcam. Abcam, https://www.abcam.com/en-us/products/assay-kits/bradford-assay-kit-ab102535 (accessed 13-May-2026).
- Quick StartTM Bradford Protein Assay. Bio-Rad, https://www.bio-rad.com/en-us/product/quick-start-bradford-protein-assay?ID=5ec149ee-0cd1-468b-8651-a2fe9de6944d (accessed 13-May-2026).
- Bradford Reagent. Millipore-Sigma, https://www.sigmaaldrich.com/US/en/product/sigma/b6916#product-documentation (accessed 13-May-2026).